When I conduct workshops in monitoring and evaluation, one of the topics discussed is "impact." When impact is defined in a workshop as, "the net change directly attributed to the project interventions," then it requires using and explaining its related terminology, such as "randomization," "selection bias," "attribution," "counter-factual," "double-difference," and "net-change." Attempting to define each of these terms and have them understood by workshop participants who may be unfamiliar with experimental design is challenging.
To help illustrate these concepts and terms I use an game on the first and last days of the workshop. On the first day of the workshop, as just an ice-breaker, a sheet of paper with a number is placed on the notebook of each workshop participant. Using a randon number generator on my computer, I choose two numbers and the two workshop particpants who have these numbers form one team. Then I randomly generate two more numbers and these two particpants form the second team.
On a table in the workshop, I have the game, Perfection, by Milton Bradley (see picture below). (For those unfamiliar with Perfection it is a plastic box with holes of 16 different shapes in a 4x4 arrangement. The goal is to take 16 plastic shapes and place them in their matching hole in the least amount of time.) The rest of the workshop participants are on the other side of the table either cheering or jeering. One person is chosen to be the timekeeper. All 16 plastic pieces are placed in a pile on the table in front of Team 1 and when the timekeeper says "go" Team 1 starts putting the pieces in their matching holes in the Perfection box. Once all pieces are in, the timekeeper shouts how much time it took them. For example, "1 minute, 45 seconds!"
Perfection, a game by Milton Bradley.
Then Team 2 gets their chance to place all 16 pieces in their matching holes, with the timekeeper shouting out the time it took them. (Of course, there are the usual arguments if the timekeeper is correct.)
On the first day that is all that I do....just use the game as an energizer. HOWEVER, at the end of the first day of the workshop I randomly select one of the teams (in this case Team 2), and I gave them the Perfection game and asked them to SECRETLY practice the game until the last day of the workshop.
On the last day of the workshop, again as an energizer, I asked both teams to come to the table and redo the Perfection game, with the timekeeper to record their time, to see which team was faster. After having both teams redo the Perfection game, I along with the secretly chosen team (Team 2), told the other workshop particpants that they had been practing the Perfection game since the 1st day of the workshop.
After Team 1 settles down from being upset since they were not allowed to practice too, we all gathered at a flip chart with the timekeeper and a list of the impact evaluation terminology I mentioned above. We discussed why I randomized the team members, how this was meant to reduce selection bias (most coordinated participants were not necessarily selected nor people who had played games together before), and how Team 2 formed the factual (the effect of practicing) and Team 1 formed the counter-factual (not practicing).
Next, I had the timekeeper calculate the single differences and the double-difference of the change in time for each team to complete the Perfection game. So, on the flip chart paper, the timekeeper calculated:
Single Differences (absolute change):
Team 1: 90 secs (Time 2) - 120 secs (Time 1) = -30 secs
Team 2: 125 secs (Time 2) - 180 secs (Time 1) = -55 secs
Double-Difference:
55 secs (Team 2: factual) - 30 secs (Team 1: counter-factual) = 25 secs
Net Change: 25 secs
Attribution: That without practicing, having played the Perfection game at least once can decrease the amount of time it takes to complete it a second time. However, practicing for about an hour each day of the 3-day workshop results in even a greater decrease in the amount of time to complete the Perfection game. In this case, of the 55 second decrease in time for Team 2, 25 seconds can be attributed to practicing (the intervention).
Thus, if this were a project that had a training activity that conducted a baseline and end-line of training participants, without the counter-factual a project would report that its training reduced the amount of time to complete the Perfection game by 30.6% (55 secs/180 secs); however, the counter-factual shows that the training had only a 13.9% effect (25 secs/180 secs) on reducing time.
And, as you may have already thought, after this blog I will have to change my "impact" exercise for future workshops!
Discussion of the design, monitoring and evaluation of international development project and programs.
Design, Monitoring and Evaluation - Save the Children (SC)
- LARRY DERSHEM - Tbilisi, Georgia
- Tbilisi, Georgia
- Welcome to my (our) blog about project design, monitoring and evaluation in the Middle East, Caucasus & Central Asia Region. This blog is a forum to discuss designs for project evaluation, monitoring systems, and how to conduct evaluations. In addition, I will occasionally highlight new methodologies and techniques in research, data collection methodologies and data analysis. If you have any questions regarding DME, don't hesitate to ask. Feel free to use this blog to pose questions, highlight various projects, dilemmas and challenges in DME you confront in your projects or to share successes. Just use the Comments link below.
Sunday, March 28, 2010
Visualization of Focus Group Discussion Results
A study in youth livelihood pathways was conducted in rural Azerbaijan from April to July in 2008. The primary objective of this study was to understand the perceptions, practices and opportunities for livelihood strategies among youth by youth and their parents.
Both quantitative (survey) and qualitative (focus group discussions - FGDs) were used. The main focus of this blog is on the FGDs findings. A total of 345 youth and 108 parents were involved in 35 FGDs to disucss youth livelihood pathways. There were four FGD groups: girls, boys, mothers, fathers. In these FGDs, one of the topics discussed was, "what is needed for a successful start-up of a livelihood in your community?"
Youth and adults discussed and listed what was necessary for a successful start-up. Then at the end of each FGDs, participants were asked to score (vote) on the listed items. The results of this process was a matrix comprised of rows of issues, column of four groups (boys, girls, mothers and fathers), with the score values in the cells.
Using the free network drawing tool, Netdraw (Borgatti), the diagram below presents the connections and consensus among girls, boys, mothers and fathers on what is needed for a successful start-up of a livelihood in their Azer community.
The darker lines represent more votes and the seven issues at the top left corner were issues mentioned in the FGDs but did not receive a score by any of the participants at the end of the FGDs.
The diagram quickly shows the issues but also the degree of consensus among the four groups. In the yellow circle, the three issues of 1) tools and equipment, 2) location, and 3) financial support were mentioned and scored by all groups. Also, though not completely, but in general boys place priority on hard (material) issues compared to girls who place more priority on soft (interpersonal) issues as needed for a successful start-up.
Also, interesting, is that in this post-soviet state parents still see the need for a successful start-up business to have a "backer/supporter" which still highlights relality.
From these results, the program was able to quickly learn what were some of the livelihood issues and concerns of the youth and their parents to design more appropriate livelihood programming.
Both quantitative (survey) and qualitative (focus group discussions - FGDs) were used. The main focus of this blog is on the FGDs findings. A total of 345 youth and 108 parents were involved in 35 FGDs to disucss youth livelihood pathways. There were four FGD groups: girls, boys, mothers, fathers. In these FGDs, one of the topics discussed was, "what is needed for a successful start-up of a livelihood in your community?"
Youth and adults discussed and listed what was necessary for a successful start-up. Then at the end of each FGDs, participants were asked to score (vote) on the listed items. The results of this process was a matrix comprised of rows of issues, column of four groups (boys, girls, mothers and fathers), with the score values in the cells.
Using the free network drawing tool, Netdraw (Borgatti), the diagram below presents the connections and consensus among girls, boys, mothers and fathers on what is needed for a successful start-up of a livelihood in their Azer community.
The darker lines represent more votes and the seven issues at the top left corner were issues mentioned in the FGDs but did not receive a score by any of the participants at the end of the FGDs.
The diagram quickly shows the issues but also the degree of consensus among the four groups. In the yellow circle, the three issues of 1) tools and equipment, 2) location, and 3) financial support were mentioned and scored by all groups. Also, though not completely, but in general boys place priority on hard (material) issues compared to girls who place more priority on soft (interpersonal) issues as needed for a successful start-up.
Also, interesting, is that in this post-soviet state parents still see the need for a successful start-up business to have a "backer/supporter" which still highlights relality.
From these results, the program was able to quickly learn what were some of the livelihood issues and concerns of the youth and their parents to design more appropriate livelihood programming.
Saturday, March 27, 2010
Network Visualizations of Qualitative Data
I would like to highlight a great website that discusses the use of network analysis to analyze and visualize data. The website founder and maintained by Rick Davies and you can find a special page on this site devoted to network visualization of qualitative data.
Rick's discussion of using network analysis and visualization of pile sorts is especially useful. He provides interesting diagrams for the connections between sorted items, categories, and participants, which is helpful for project planning or evaluation.
Network Analysis & Visualization of Qualitative Data
An approach to measuring and mapping connections between concepts, opinions, formal and informal relationships and/or exchange of resources between individuals, groups or organizations is network analysis. Network analysis is a technique that allows you to both quantitatively (statistically) and qualitiatively (graphically) analyze connections or linkages between and within various units, whatever those are.
In 2003, I used network analysis for measuring and mapping inter-organizational coalition building for a Prevention Task Force (PTF) in an HIV/AIDS prevention project funded by USAID. One objective of the project was to promote advocacy and policy reform in the area of surveillance, services and prevention of STIs and HIV/AIDS. The project invited a broad, cross-sectional group of stakeholders who had previously been working on issues of STI/HIV/AIDS in the country to join the PTF, which included the government ministries, UN agencies, local NGOs, international PVO/NGOs, and various donors. Initially, the PTF was comprised 32 member organizations and agencies.
The objective of using network analysis was to measure and map the intial interactions of the young coalition of PTF members on 1) exchaning information, 2) sharing data, and 3) sharing technical assistance.
Using a questionnaire, PTF members were asked to report separately how often over the last year their organization had exchanged HIV/AIDs information, data or technical assistance with other PTF members.
Using "on a monthly basis" as the cut-off, the follwing graph shows the PTF coalition network on only "exchanging technical assistance," at the baseline in 2004 and at the end-line in 2007. I will present both the quantitative and qualitive findings. First, the quantitative findings.
Membership: reduction from 32 to 22 members
Isolates: reduction from 12 to 0 members
% of members receiving technical assistance: increase from 53% to 96%
% of members giving technical assistance: increase from 41% to 68%
Main inter-organizational brokers: National AIDS Center and Save the Children in 2003 to National AIDS Center and a local NGO in 2007.
Second, the qualitative findings are the two network graphs of exchanging technical assistance within the PTF. The dots and colors represent the different organizations or government ministries who were members of the PTF.
Prevention Task Force (PTF) 2004
Prevention Task Force (PTF) 2007
In addition, the baseline mapping was used as a type of action research with the PTF...to show who was or was not exchanging technical information and why. As you can readily see, many of the "isolate" organization in 2003 were not members in 2007.
So, network analysis is a powerful tool for measuring and illustrating all types of connections or relationships between various types of people, households, groups, organizations, districts, and nations as well as concepts!
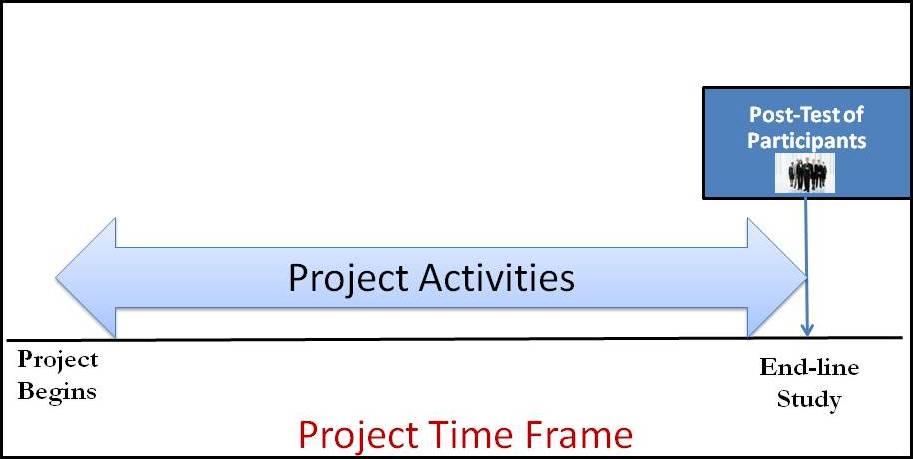
Post-Test of Only Project Group, Design # 8
Of all the evaluation designs I have presented, this is the weakest and any findings from using ONLY this design would need to be viewed with a lot of caution!
Some of the reasons this design is so weak at evaluating a project are: a) without a pre-test or baseline it is difficult to show that a change has occurred, b) if change did occur how much, and c) without a comparative group it is difficult to argue how much the project interventions were responsible for any of this change.
This type of evaluation design is best used only with very small projects, in rather isolated contexts, using and adhering to proven strategies and interventions, and including mixed methods (secondary data, key informant interviews, focus groups, etc.) to bolster the findings.
Friday, March 26, 2010
Pre- and Post-Test Project Group (no comparison), Design #7
This design begins at the start of the project; however, baseline data is collected on for the project group and not for a comparative group. The reasons for not including a comparative group could be lack of awareness of evaluation design, budget, time, or other constraints.
This design works best IF (yes, a big if) the project is based on and adheres to already reasonably proven theory of change, strategies, and interventions related to the outcomes being measured in a similar context. This design is more useful to understand how the process of project implementation accomplished expected outcomes.
The basic flaws of this design are that it cannot provide very precise estimates of project's impact on the outcomes and that due to lack of a comparative group it is difficult to determine the potential for scaling-up the project.
Again, to improve on this design, other methods need to be used such as key informant interviews, focus group discussions, in-depth interviews, and personal history recall.
Post-test Comparison of Project and Comparison Groups, Design #6
In this design, no baseline data was collected for the project group or a comparative (non-project) group and relies completely on end-of-project comparisons between the two groups. This design can be used when do baseline data study was conducted due to time, funding, staffing or situational (e.g., conflict) constraints, or if a baseline cannot be reconstructed (Michael Bamberger has written extensively on reconstructing baselines). It is more effective when used in isolated communities or settings that have little or minimal outside influences (which is getting hard to find these days).
The basic flaws of this design are that it does not account for possible influencial historical events, substantial pre-existing differences, or possible differential trajectories over time between the two groups.
To improve on this design, other methods need to be used such as key informant interviews, focus group discussions, in-depth interviews, and personal history recall.
Subscribe to:
Posts (Atom)